How use controls
Modbus registers are mapped to the variables named Var0, Var1, Var2,... where the number is the register address
For example register address 40003 represented as Var40003
On a graphical dashboard page, add controls with desired variable names, and press "Apply"
Example of gauge and chart controls:
{::gauge2(Var0){.##,0,500,Power,200}::}<br/>

          {::chart(Var0,Var1,Var2){400,420,1h30m}::}
Check available controls in toolbox
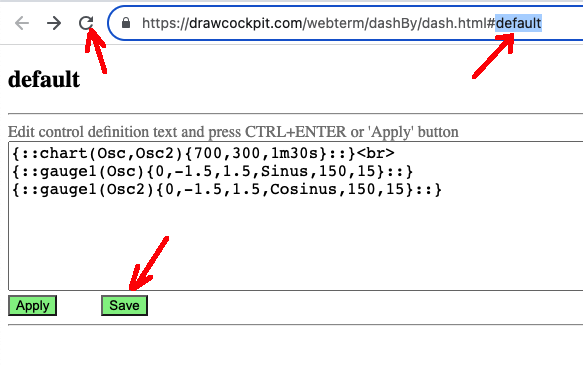
How to save the dashboard under new name
1. Click on dashboard page you want to copy
2. Change the dashboard name in the URL
3. Refresh the page
4. press Save button